Services
26,636,507
Sessions since launching
1,936,068
Peak number of daily active users
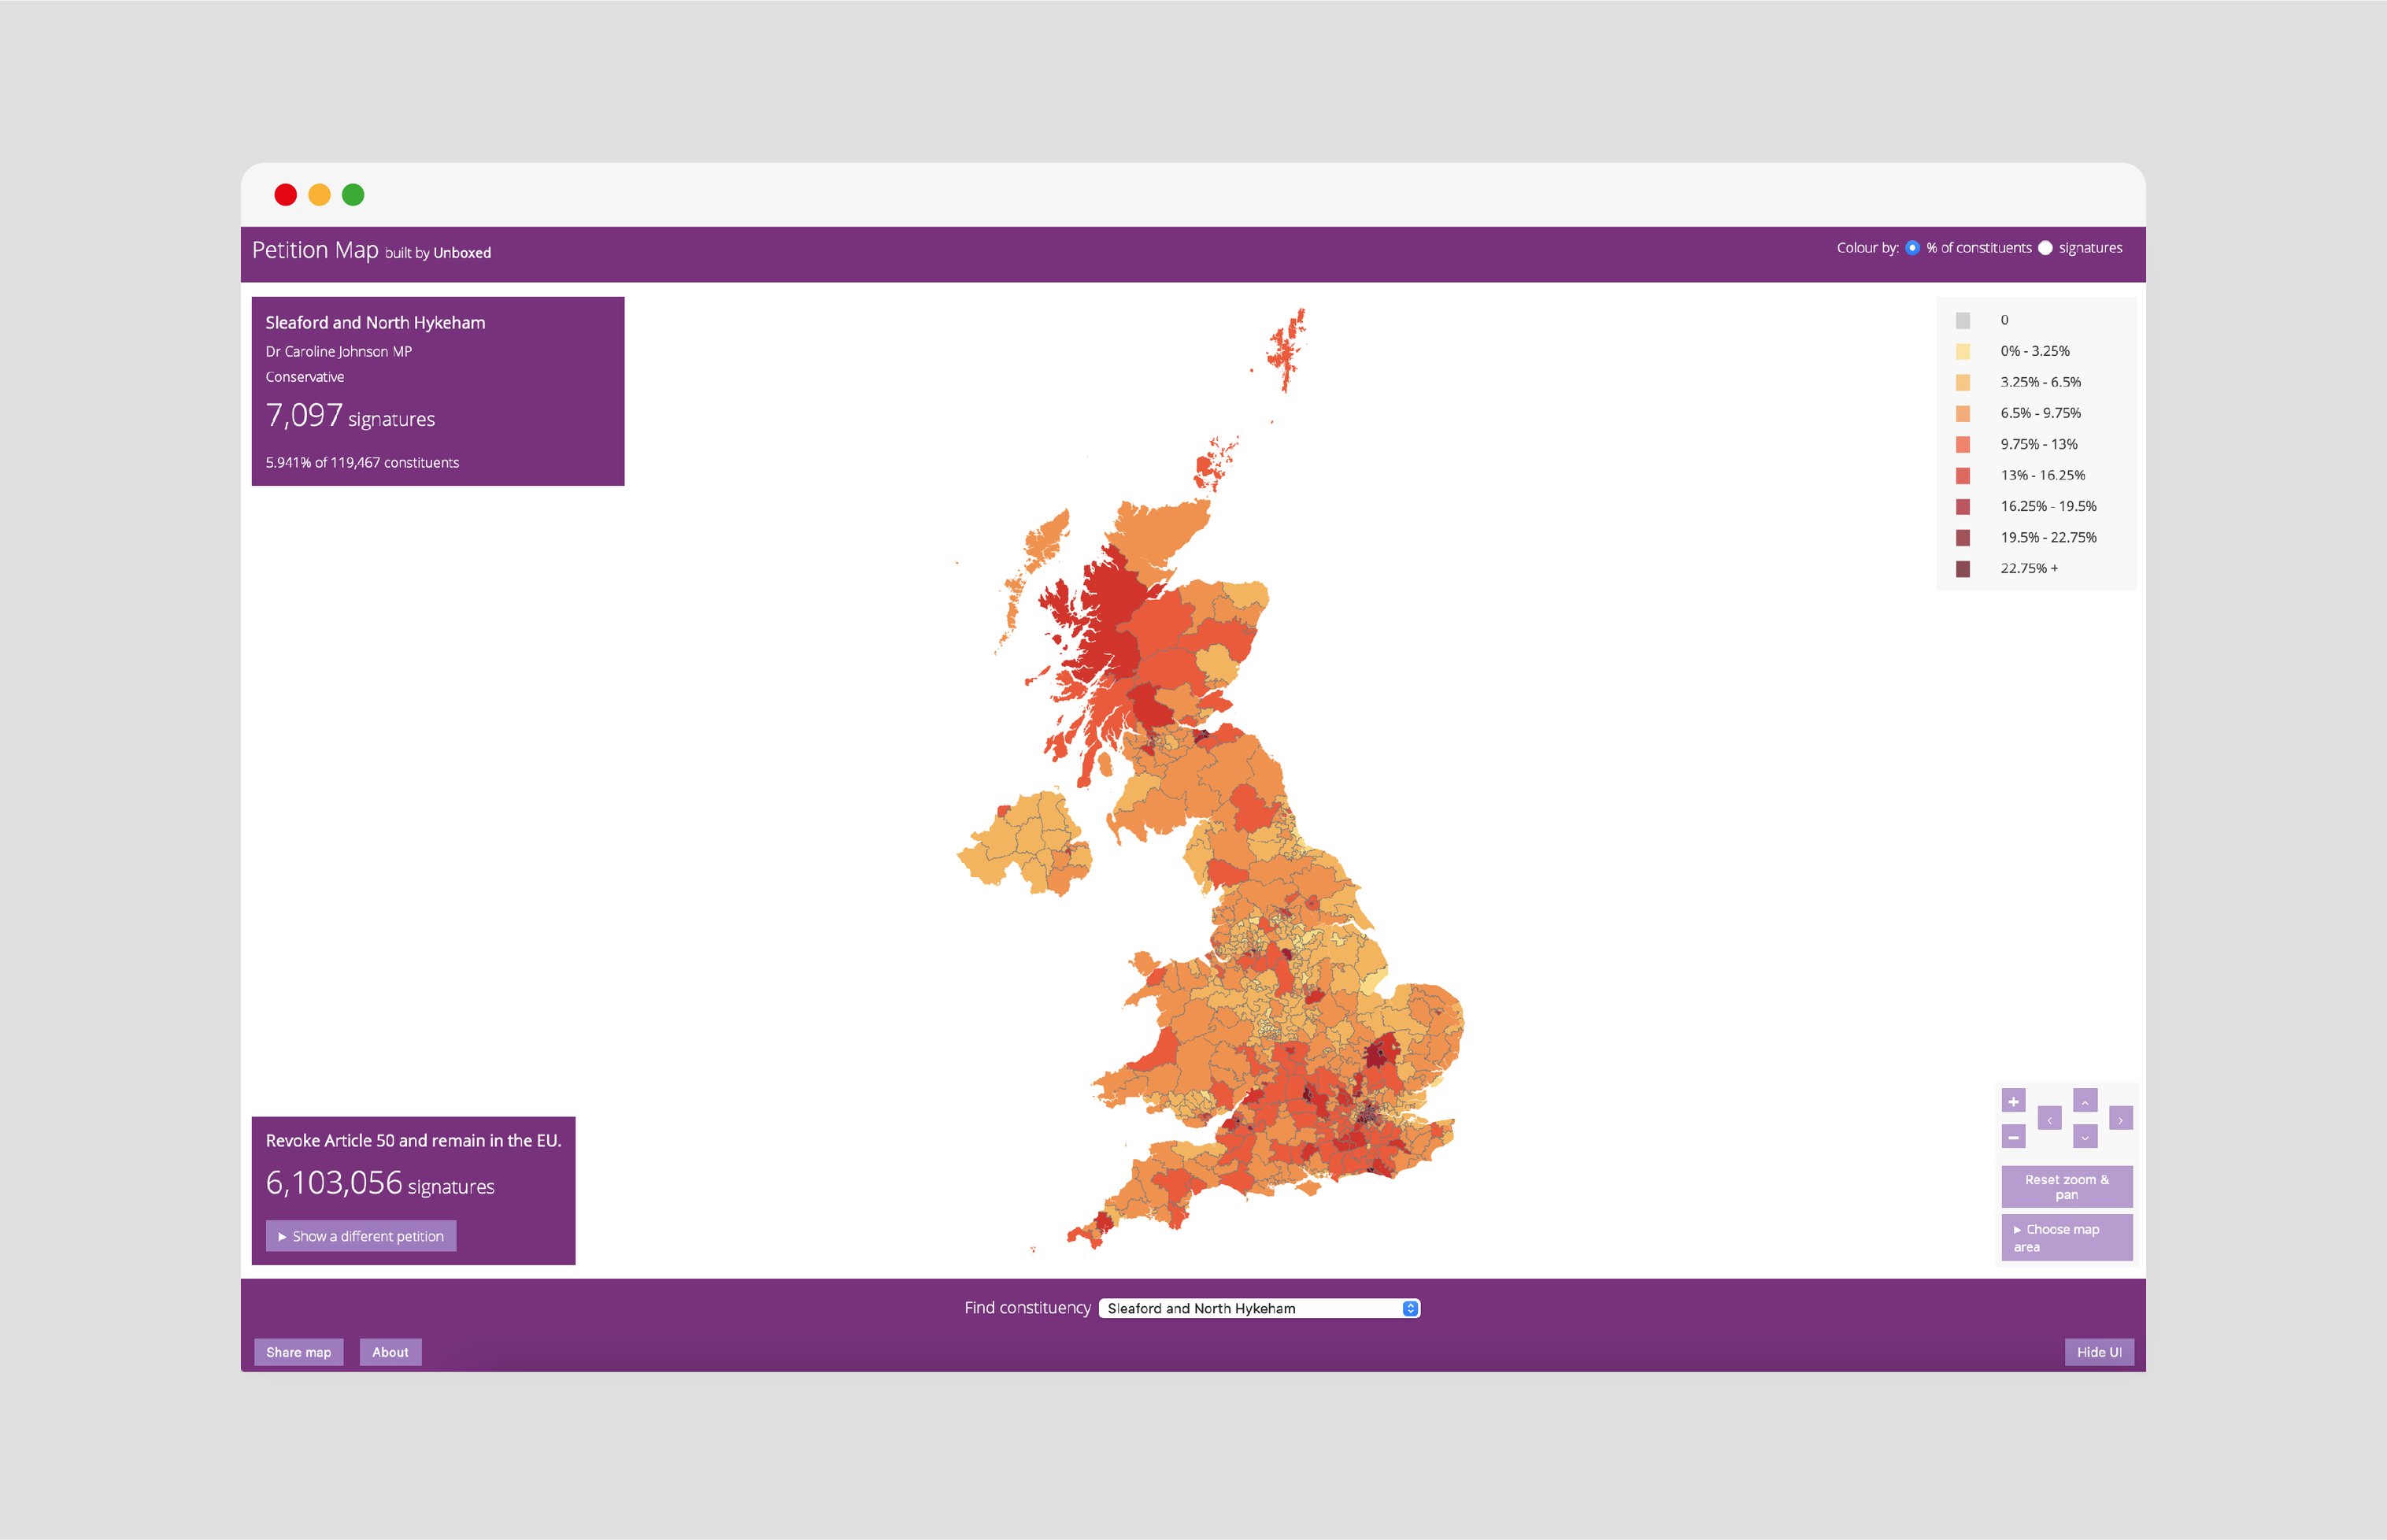
Petition Map is an interactive heat map, which enables users to visualise signatures received on petitions from UK Government and Parliament Petitions on a real-time map of the United Kingdom. Following our work with Government Digital Service (GDS) to design, develop and launch UK Government and Parliament Petitions, one of our intern developers, Cale, spent innovation time during his summer with Unboxed to explore and develop this heatmap to support the Petitions platform for members of the public.
Cale Tilford | Developer | Unboxed
“It’s been exciting to see online newspapers featuring Petition Map in articles relating to popular petitions and use it to gain an insight into where petitions are most popular. People are also sharing it on social media when promoting petitions that are important to them.”
Petition Map pulls the JSON data of each individual live petition, enabling users to select from a list of active petitions to visualise, with the popular Javascript library D3 used to render the outline of each parliamentary constituency. Each instance a petition is loaded, the colour scale is calculated relative to the total number of signatures, with each constituency then coloured in relation to this.
Cale Tilford | Developer | Unboxed
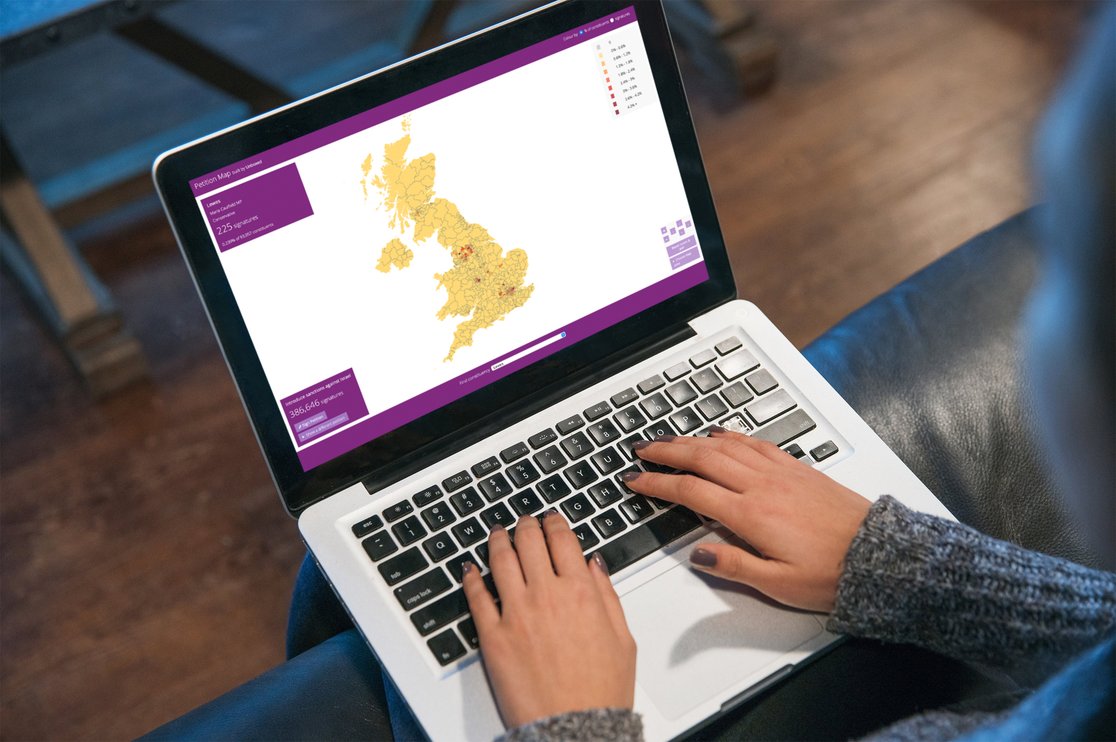
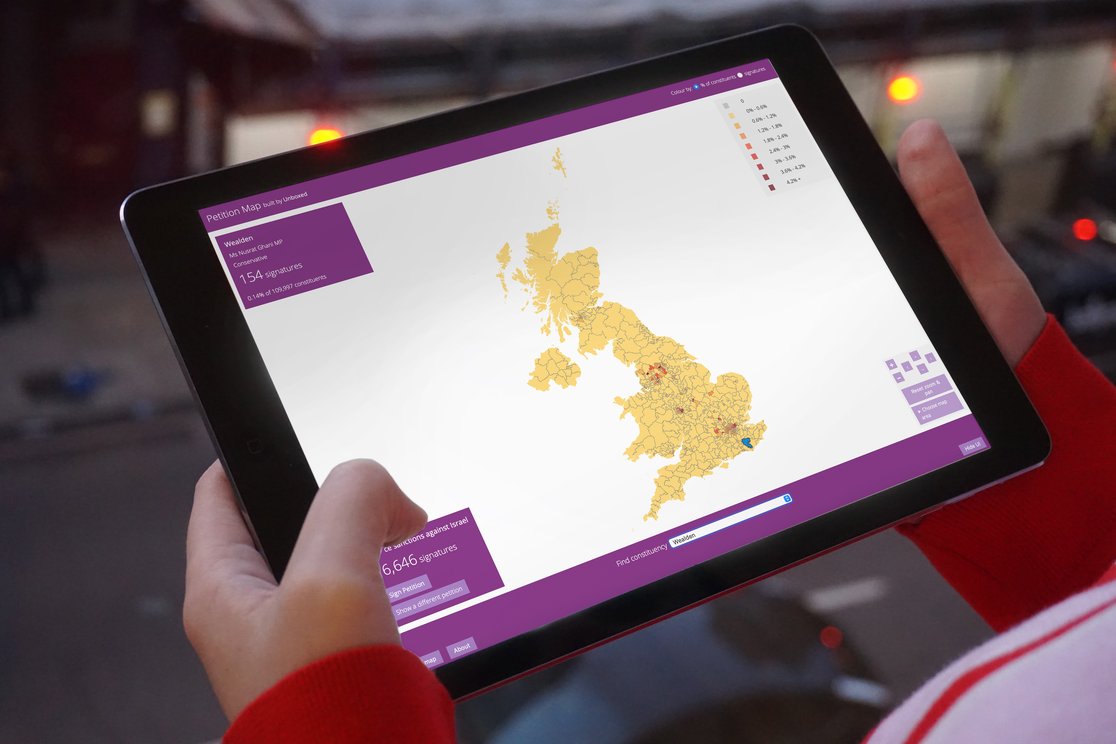
“Petition Map has been developed to work on a wide range of devices, including mobile, tablet and desktop, so that petitions can be visualised even when on the move. The tool is constantly being iterated using the feedback that we receive from people using it.”
Following a number of high-profile political topics, Petition Map has built up a public following, appearing in publications such as The Independent. Petitions such as ‘Block Donald J Trump from UK entry’ and the more recent four-million-signature receiving ‘EU Referendum Rules triggering a 2nd EU Referendum’ have caused a sharp surge in map users, with the number of sessions crossing four million since launching.
Cale Tilford | Developer | Unboxed
“Since the EU Referendum petition, by popular demand the map has been updated with a new colouring option – weighting each constituency with its population. Hovering over each constituency also shows you the percentage of constituents that have signed. These new features make Petition Map an even more useful tool for examining regional engagement with politics.”