Designing and building data-driven dashboards with UAL
The newly-formed Digital & Technology Student Support Services team at UAL wanted to harness the power of data to inform their decisions. We helped them get closer to that vision by clarifying what they needed from the data, identifying what was currently available, and co-creating dashboards and workflows that would set them up for long-term success.
What we did
Discovery
Stakeholders engagement
User research (interviews and prototype testings)
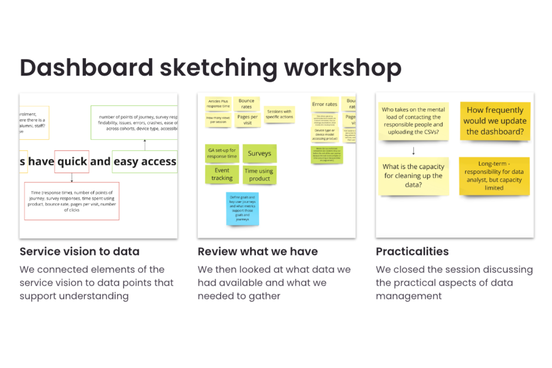
Co-design workshop
Prototyping
Background
The University of the Arts London (UAL) Student Support Services team is a newly-formed group dedicated to providing a range of services that support students' academic and personal well-being. Their work spans multiple areas, including pastoral care, academic study support, and access to library resources. As part of UAL's Digital and Technology division, the team plays a crucial role in enhancing the student experience by offering services that help students thrive, both academically and personally, whether they’re on campus or studying remotely.
The Challenge
The challenge wasn’t just about building a dashboard; it was about understanding the bigger picture. The Student Support Services team had a diverse range of products across pastoral care, study, and library services. They needed a way to bring these products together, establish a data-driven approach, and fill in the gaps where data was missing. Our task was to create a dashboard that would lay the foundation for this vision, helping them understand their products and their data while also equipping them with the tools to continue this journey long after our project was complete.
Our approach
On the surface, our goal was to deliver a dashboard for all 16 products in the team’s portfolio. But before we could even begin designing, we had to take a step back and help the team understand what data they had and what more they could access. The dashboard became less of an end goal and more of a vehicle for helping this new team grow its data maturity.
We quickly realised we wouldn’t be able to cover everything in the project’s timeframe, so we had to prioritise. Our focus shifted to generating the most value within the time we had, using a selection of products to learn approaches and patterns that could be applied to the others. By interviewing product teams and stakeholders, we discovered what data was currently available and began exploring ways to improve its accessibility and quality.
But data alone isn’t enough. We needed to understand the users—the Student Support Services team—and how they would use the dashboard. We ran exploratory sessions and interviews to dig into their needs and expectations. This set the stage for a co-design workshop where we refined their needs and sketched dashboard concepts. Ideas started coming together: glossaries, contextual insights, and shared data points to support comparison.
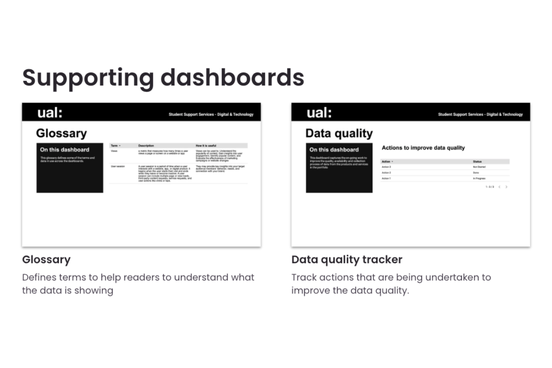
As the project neared its end, we moved quickly to hand over tools that would empower the team moving forward. We built template dashboards using Looker Studio, provided documentation of the current data maturity across the prioritised products, and created step-by-step guides to ensure the team could continue building on what we’d started.
What we learnt
We learned that sometimes, a project that seems focused on building a dashboard is really about something much deeper. The dashboard was the surface-level request, but what the team truly needed was a way to engage with data thoughtfully and establish a best-practice foundation for their work. The dashboard became a catalyst for broader conversations about data quality, accessibility, and the team’s role within the organisation.
At the same time, delivering a tangible result was crucial. The team needed to show they could produce something valuable—something concrete to build their momentum and establish credibility. Prioritising and being honest about what could realistically be achieved within the timeframe was key to our success.
Beyond the project
This project laid the groundwork for a data-driven future at UAL. The Student Support Services team now has the tools, templates, and knowledge to work with data as part of their everyday processes. Looking ahead, they’ll be able to use dashboards to track performance, set improvement goals, and measure success over time, driving both their team and UAL’s services forward.
Get started today
Ready to transform your team's data approach like we did for UAL? Let's collaborate to create impactful, data-driven solutions tailored to your needs. Contact us today to start your journey toward long-term success