The new Petitions site has been a massive success since its launch this July, with tens of thousands signing petitions each day. It was suggested to me that it would interesting to visualise this data with a heatmap - giving an insight into the popularity of individual petitions across the UK. My aim is that these visualisations are not only interesting but can be of use when focusing campaigns on certain issues around the country.
Allow me to introduce Petition Map:

Petition Map allows users to select from the most popular petitions, signature-wise (with the option to input the URL of any smaller petitions) and regions of the UK to generate new heatmap visualisations:

Users can search through each constituency (or hover over parts of the map) to find out the number of signatures on each petition in each individual area:

Petition Map has been built to work on both desktop and mobile so that petitions can be visualised even when on the move:

How to use Petition Maps
Petition Map defaults to the most signed petition, but other popular petitions can easily be found using the searchable dropdown menu. It’s also possible to change the area that the map displays which is useful for more regional petitions (Northern Ireland is currently not supported at this time) i.e. Scotland:
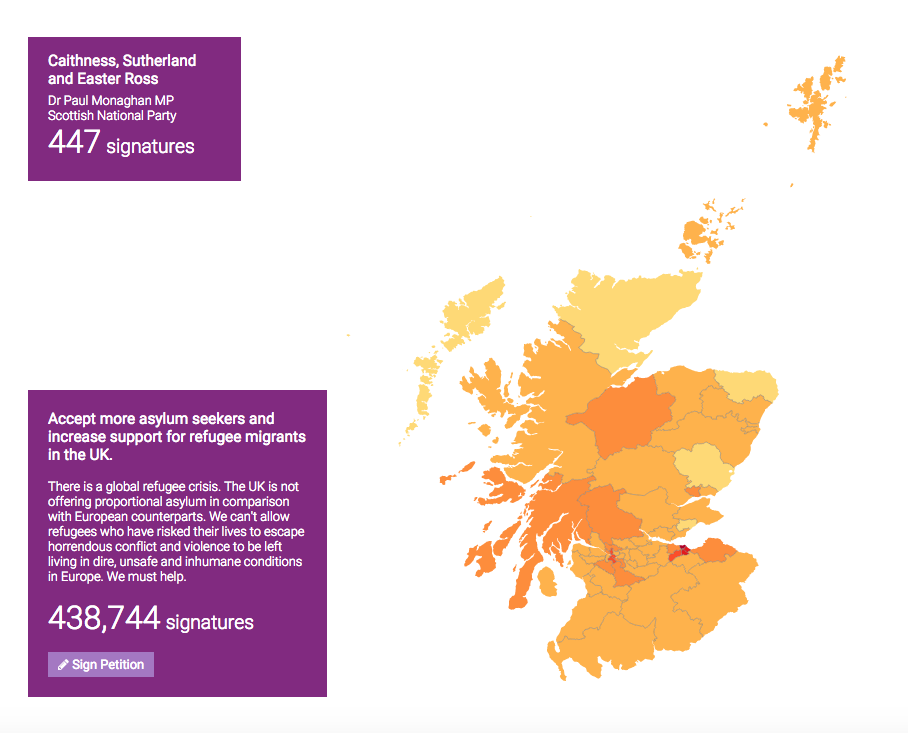
Any constituency can be highlighted by using the searchable constituency dropdown or by hovering over a constituency on the map. The colour of the highlighted area corresponds the party of that constituencies’ MP, along with their name:

The map itself supports zoom using the control panel on the right but if you’re using a mobile device or a supported trackpad - pinch to zoom can be used too:

If you find a map you want to share you can use the Share Map button to generate a link or share directly to Twitter or Facebook.
If you want to take a screenshot or you’re using a device with a low resolution, parts of the user interface (UI) can be hidden in the settings panel, for a clearer overall map view:

Technology
A recent addition to the Petitions site now allows developers to request data in JSON format (by appending .json to any petition url). As well as the total number of signatures, each petition holds an array of signatures by country and constituency with the latter being the data used by Petition Map.
The ONS code of each is used to match the Petition data with the constituency boundaries. I used boundary data in TopoJSON format, an extension of GeoJSON, which was was sourced from here.
To generate heatmaps I used the popular javascript library D3 which allows you to easily create interactive maps for the web (see here for more). Every time a petition is loaded, a set of signature ranges is calculated relative to the number of signatures for that specific petition - these are then used to colour the map.